Chat
Chat is the main way to interact with your data in DataXpert.
How it works
Section titled “How it works”Ask a question in everyday language, and DataXpert returns the answer as a table, chart, or summary — drawn from the data source you picked. Every answer comes with the underlying data so you can see exactly where it came from.
Starting a chat
Section titled “Starting a chat”- Click New Chat in the sidebar (this is also the app’s default landing).
- Pick the data source (or sources) you want to ask about — multi-source is supported.
- For a single database, click Tables to focus your question on specific tables.
- Use the Chat / Dashboard toggle to choose whether you want a Chat answer or a Dashboard. Dashboard mode is disabled when more than one source is selected.
- Type your question and press Enter, or click the send arrow.
Example questions:
- “What were the top 10 products by revenue last month?”
- “Show me the monthly trend of new customer signups.”
- “Compare sales across regions for Q1 vs Q2.”
Viewing results
Section titled “Viewing results”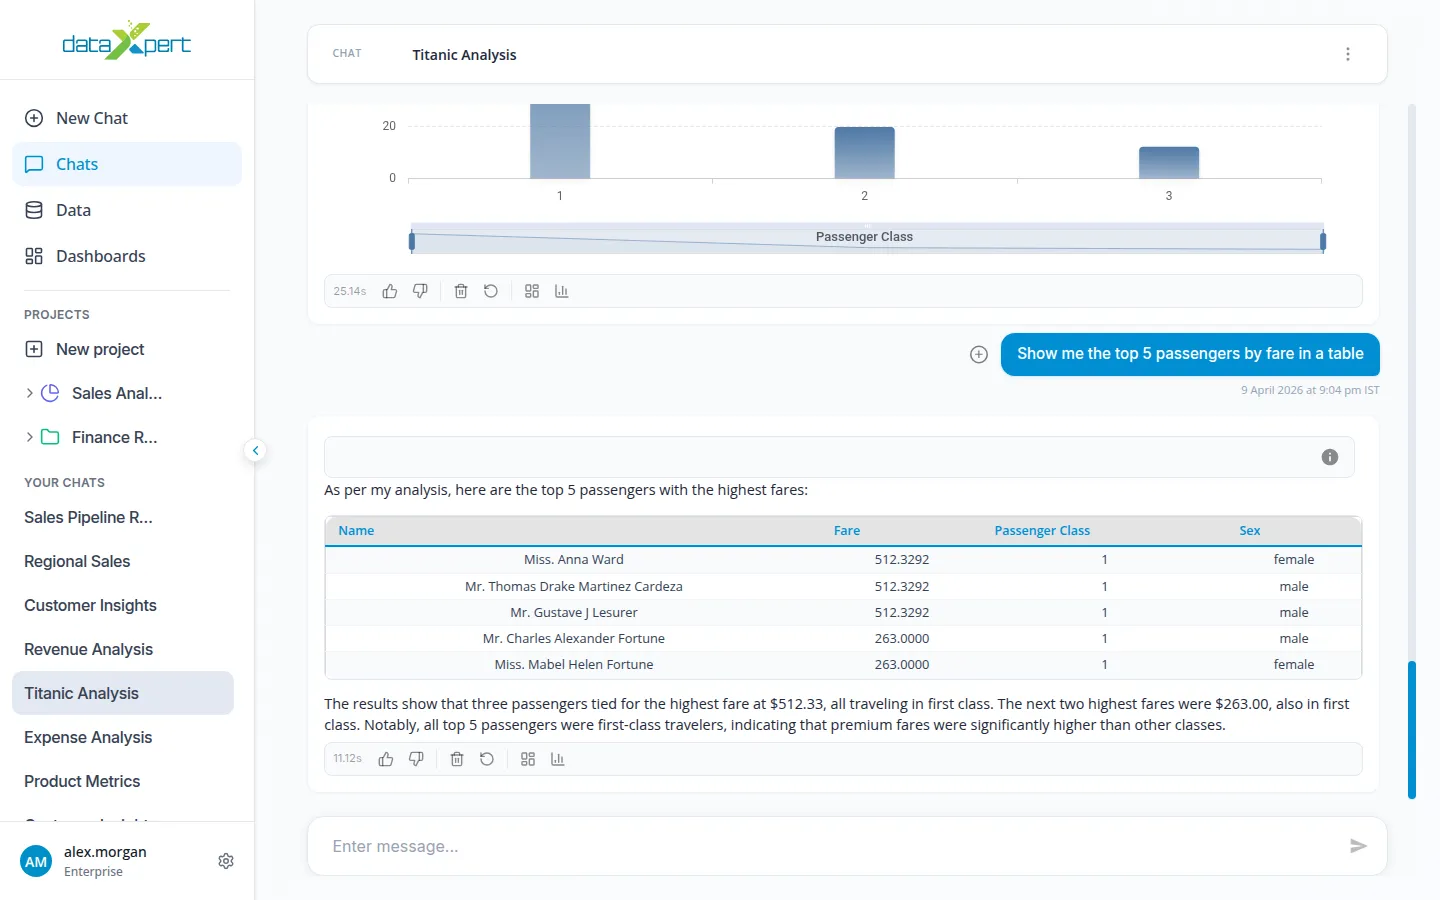
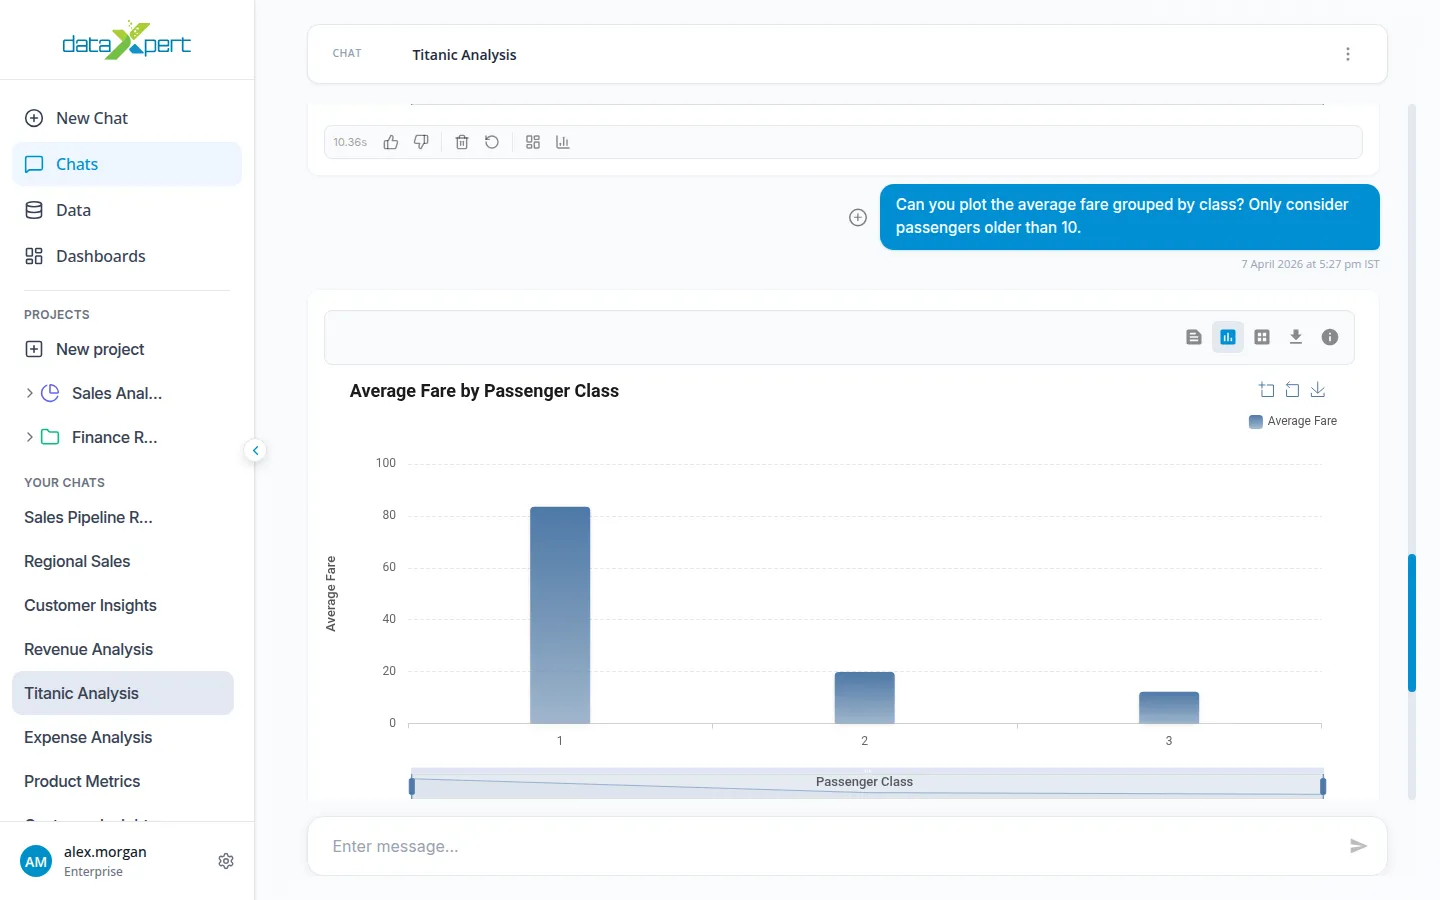
Results come back as tables, charts (bar, pie, line, scatter, bubble), or statements. The toolbar above each result lets you switch between views and act on the data.
Top toolbar (above each result)
Section titled “Top toolbar (above each result)”- View Statement — show the natural-language summary.
- View Chart — render the result as a chart.
- View Table — render the result as a table.
- Download answer in CSV — download the table as
.csv. - Code & Explanation — see exactly how DataXpert arrived at the answer. Click Generate Explanation for a plain-English walkthrough.
Bottom toolbar (feedback and actions)
Section titled “Bottom toolbar (feedback and actions)”- Like / Dislike — give thumbs-up/down feedback on a response. Disliking opens a follow-up dialog where you can add a reason.
- Delete message — remove a single response.
- Re-generate — re-run the original prompt.
- Export to Dashboard — open a dialog of compatible dashboards and move the chart into one of them. If no compatible dashboard exists, the dialog tells you so.
- Retry Chart — regenerate just the chart for that response.
Voice input
Section titled “Voice input”The voice-input button next to the message box lets you dictate your question. The icon turns red while listening. Voice input works best in modern browsers like Chrome, Edge, and Safari.
Long-running questions
Section titled “Long-running questions”Some questions take a moment to answer — you can keep working in another chat while the answer comes through. While an answer is being prepared, a Stop control replaces the send button so you can cancel.
Chat management
Section titled “Chat management”From the sidebar’s chat list you can:
- Rename a chat inline.
- Delete a chat.
- Move to project — drop a chat into a project folder.
Citations and sources
Section titled “Citations and sources”When the answer is based on documents you’ve uploaded, DataXpert shows a View Sources chip below it. Click to see the exact passages the answer came from.