Dashboards
Dashboards turn your data into a single view of the metrics that matter.
Creating a dashboard
Section titled “Creating a dashboard”- Click Dashboards in the sidebar.
- Click New Dashboard at the top right.
- Fill in the Dashboard setup form:
- Data type — Spreadsheet or Database.
- Select Spreadsheet or Select Database — pick the source.
- Select Tables (database only) — focus the dashboard on specific tables.
- Dashboard name — required.
- Additional instructions — optional, free text. Use this to describe how the dashboard should look.
- Click Next to start building.
DataXpert builds the dashboard for you in the background. It appears on the Dashboards list with a status of Processing until it’s ready.
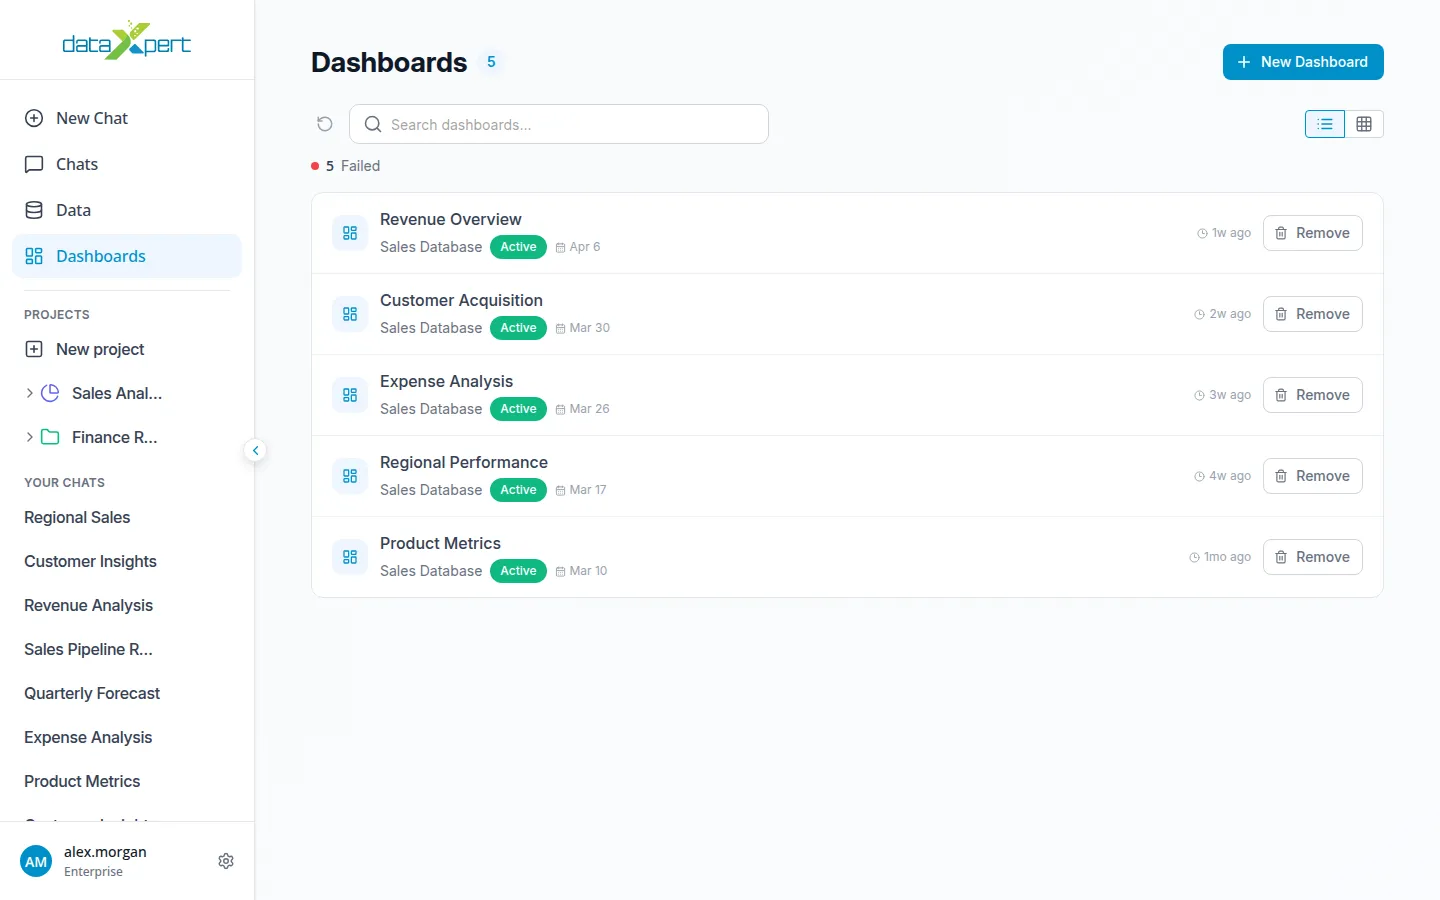
Managing dashboards on the list
Section titled “Managing dashboards on the list”Each card on the Dashboards list shows its status (Ready / Failed / Stopped / Processing) and one of these actions:
- View — open a finished dashboard.
- Retry — try again if it failed or was stopped.
- Stop — cancel a dashboard that’s still being built.
- Remove — delete a dashboard.
Inside a dashboard
Section titled “Inside a dashboard”The dashboard detail page shows two sections:
- Key metrics — KPI cards.
- Visualizations — chart cards.
You can also pick a different dashboard from the dashboard selector at the top.
Adding charts to an existing dashboard
Section titled “Adding charts to an existing dashboard”To add a chart to a dashboard:
- Open the dashboard.
- Click Add Chart or KPI at the bottom.
- Type a prompt describing the chart you want.
DataXpert builds the new chart and adds it to the dashboard.
Adding charts from a chat
Section titled “Adding charts from a chat”In a chat, the result toolbar has an Export to Dashboard action that opens a dialog showing compatible dashboards. Pick one and click Move to add the chart there. See Chat.
Chart types
Section titled “Chart types”Bar, pie, line, scatter, and bubble charts, plus KPI cards and statistic summaries.